Dashboards & Reporting
A comprehensive guide to VATable's reporting suite: six custom dashboards powered by live GHL data, plus the built-in GoHighLevel reporting tools. Everything you need to track enquiry sources, conversion rates, team performance, and business trends.
Contents
- Overview of VATable's Reporting Suite
- How to Access the Dashboards
- MI Dashboard - Tab 1: Client Overview
- MI Dashboard - Tab 2: Financial Overview
- Enquiry by Source (R2)
- Conversion Funnel (R3)
- Team Activity (R4)
- Lost Opportunities (R5)
- Weekly & Monthly Trends (R6)
- GHL Built-in Reporting
- Reporting Cadence - How Often to Review
- Debtors Dashboard (R1) - Planned
1 Overview of VATable's Reporting Suite
VATable's reporting ecosystem consists of six custom-built dashboards that pull live data directly from the GoHighLevel CRM via its API, plus the built-in GHL reporting tools accessible from within the platform. Together, these give Charles and the team a complete picture of the business at any time.
Custom Dashboard Index
2 How to Access the Dashboards
Custom Dashboards (HTML Files)
All custom dashboards are stored locally on the VATable project folder. To open any dashboard:
- Navigate to the dashboard folder on your computer:
VATable/docs/dashboards/ - Double-click the HTML file you want to open - it will launch in your default web browser.
- Wait a few seconds for the data to load from GHL (you will see a loading spinner).
- Once loaded, the dashboard displays live data from your GoHighLevel CRM.
Dashboard File Locations
| Dashboard | File Name | Location |
|---|---|---|
| MI Dashboard | VATable_MI_Dashboard.html | VATable/ (project root) |
| R2 - Enquiry by Source | enquiry-by-source.html | VATable/docs/dashboards/ |
| R3 - Conversion Funnel | conversion-funnel.html | VATable/docs/dashboards/ |
| R4 - Team Activity | team-activity.html | VATable/docs/dashboards/ |
| R5 - Lost Opportunities | lost-opps.html | VATable/docs/dashboards/ |
| R6 - Weekly/Monthly Trends | weekly-monthly-trends.html | VATable/docs/dashboards/ |
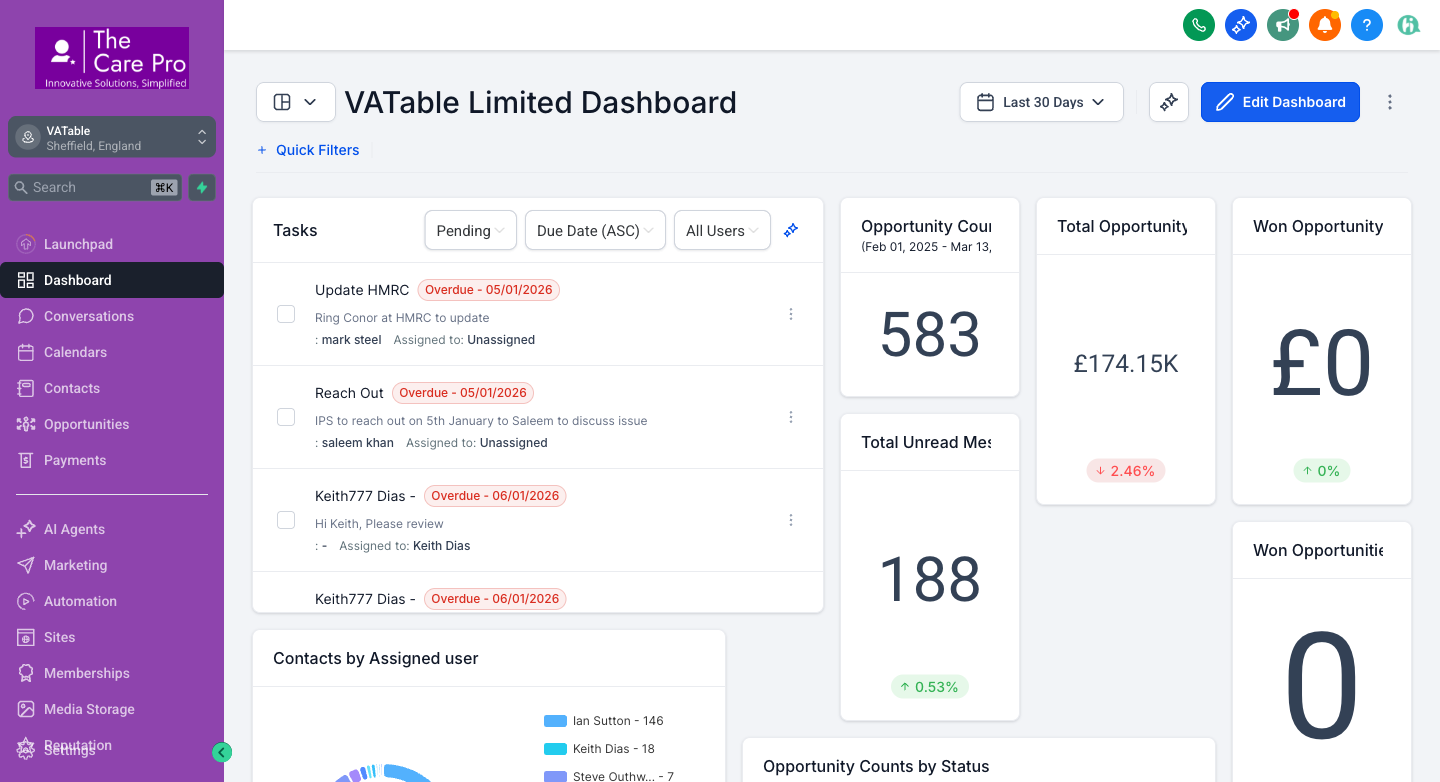
GHL Built-in Dashboard & Reporting
GoHighLevel has its own built-in dashboard and reporting tools, accessible directly from the CRM:
- Log into link.thecarepro-ai.co.uk
- Make sure VATable (Sheffield, England) is selected as the active location in the top-left dropdown.
- Click Dashboard in the left sidebar for the main overview.
- Click Reporting in the left sidebar (scroll down) for the full reporting suite.
3 MI Dashboard - Tab 1: Client Overview
The Management Information (MI) Dashboard is the primary executive-level view of VATable's business performance. Tab 1 focuses on your client portfolio:
What Tab 1 Shows
- Total contacts in GHL - The complete count of all contacts stored in the CRM, including enquiries, prospects, and active clients.
- Retained clients - The number of contacts who have progressed to an active engagement (signed and retained).
- Engagement value - The combined monetary value of all current engagements, giving you a snapshot of your active book of business.
- Retained-to-contact ratio: If you have many contacts but few retained clients, your conversion process may need attention.
- Engagement value trend: Compare this number week-on-week to see if your book of business is growing.
- New contacts vs retained: A healthy pipeline shows steady new contacts flowing through to retained status.
4 MI Dashboard - Tab 2: Financial Overview
Tab 2 of the MI Dashboard provides the financial and lifecycle view of your engagements:
What Tab 2 Shows
- Billing date overview - Shows upcoming billing milestones for active engagements, helping Ruby and the admin team plan invoicing.
- Life of engagement - Tracks how long each engagement has been active, identifying which engagements are approaching their expiry date.
- Book value - The total combined value of all current retained engagements - your recurring revenue snapshot.
- Upcoming billing dates: Ensure invoices are prepared before billing dates arrive.
- Engagement expiry alerts: Engagements nearing their expiry date need renewal conversations (WF9 and WF12 automate reminders for this).
- Book value growth: This number should grow as new engagements are signed. A declining book value may indicate churn.
5 Enquiry by Source (R2)
The Enquiry by Source dashboard answers the fundamental question: "Where are our enquiries coming from?" It fetches all contacts from GoHighLevel and groups them by their recorded lead source.
Dashboard Components
Summary cards across the top:
Horizontal bar chart: Shows the top 20 lead sources ranked by enquiry volume. Each bar is colour-coded and shows both count and percentage on hover.
Source Rankings table: A complete ranked list of every lead source with columns for rank, source name, count, percentage of total, and a visual distribution bar.
- Dominant source: If one source accounts for more than 50% of enquiries, consider whether you are too reliant on a single channel.
- "Unknown" source volume: A high count of "Unknown" sources means contacts are being added without proper source tracking. Fix this at the form/import level.
- Low-performing channels: Sources with very few enquiries may not be worth continued investment - or they may need better attribution.
- Referral strength: If referrals are a top source, your client satisfaction is driving organic growth - keep nurturing it.
6 Conversion Funnel (R3)
The Conversion Funnel dashboard visualises how opportunities move through the pipeline stages - from initial enquiry through to engagement signed and service completed. It covers all three pipelines: MASTER Sales, Case Management, and Ian Sutton's pipeline.
Dashboard Components
Summary cards:
Visual funnel: Horizontal bars representing each pipeline stage, ranked by count. The widest bar is the stage with the most opportunities, giving an instant view of where deals cluster.
Bar chart: A Chart.js bar chart showing opportunities per stage with colour-coded bars.
Stage Breakdown table: Detailed breakdown by pipeline, showing each pipeline's stages with counts, monetary values, and percentage of total.
- Bottlenecks: If a stage has significantly more opportunities than the next stage, deals are getting stuck. Common bottleneck: "Proposal Sent" → "Engagement Signed".
- Signed rate target: Track this percentage over time. A healthy VAT/tax advisory firm should aim for 30%+ conversion from enquiry to signed.
- Pipeline value per stage: High values stuck in early stages represent unrealised revenue - prioritise these for follow-up.
- Stage imbalances between pipelines: Compare the MASTER pipeline with Ian Sutton's to see if conversion patterns differ by sales channel.
7 Team Activity (R4)
The Team Activity dashboard shows how opportunities are distributed across your team. It answers: "Who is handling the most work, and is the workload balanced?"
Dashboard Components
Summary cards:
Horizontal bar chart: Shows each team member's opportunity count as a horizontal bar, making it easy to spot workload imbalances.
Doughnut chart: A pie/doughnut view of the same data, highlighting each person's share of the total workload.
Team Assignment table: Lists every team member with columns for name (with avatar initials), opportunity count, total monetary value, average value per opportunity, and a visual distribution bar.
- Workload balance: If one person has 5x the opportunities of others, they may be overwhelmed. Redistribute or hire.
- "Unassigned" count: Any opportunities showing as "Unassigned" need immediate attention - they have no owner and will likely fall through the cracks.
- Value per member: High opportunity count with low total value may indicate many small cases. Low count with high value means fewer but more complex cases.
- New joiner ramp-up: Use this to track how quickly new team members are being assigned work.
8 Lost Opportunities (R5)
The Lost Opportunities dashboard analyses every opportunity that reached the "Not Moving Forward" stage. Understanding why deals are lost is critical for improving your conversion rate.
Dashboard Components
Summary cards:
Lost by Pipeline (doughnut): Shows which pipeline loses the most opportunities - MASTER Sales, Case Management, or Ian Sutton's.
Loss Value by Pipeline (bar chart): Visualises the monetary impact of losses per pipeline.
Lost Over Time (line chart): Monthly trend line showing whether losses are increasing, decreasing, or stable.
Recent Lost table: Lists the 30 most recent lost opportunities with contact name, pipeline, value, date lost, and tags.
- Loss rate trend: A rising loss rate month-over-month is a red flag. Investigate the root cause - pricing, service fit, or follow-up gaps.
- High-value losses: Sort mentally through the recent lost table. Any opportunity with a high £ value that was lost deserves a post-mortem - could it be recovered?
- Pipeline-specific losses: If one pipeline loses far more than others, there may be a process issue specific to that workflow.
- Seasonal patterns: The time chart may reveal seasonal dips where losses spike (e.g., post-tax-deadline periods).
9 Weekly & Monthly Trends (R6)
The Trends dashboard provides the time dimension that the other dashboards lack. It shows how your key metrics are changing over weeks and months, revealing growth patterns and seasonal behaviour.
Dashboard Components
Summary cards:
Contacts Added Per Month (line chart): A 12-month trend line showing new contacts added each month. The fill-under-curve makes growth/decline immediately visible.
Opportunities Created Per Month (bar chart): Shows new opportunities created each month for the last 12 months.
Weekly Enquiry Trend (bar chart): The last 12 weeks of new contacts, ideal for spotting short-term changes in enquiry volume.
Monthly Breakdown table: An 18-month table showing contacts added, opportunities created, month-on-month change percentage, and an up/down/flat trend indicator.
- Growth trajectory: Is the monthly line chart trending upward? Consistent growth in new contacts signals a healthy pipeline.
- MoM growth rate: A positive month-on-month growth is shown in green. Negative is red. Aim for consistent positive growth, but expect seasonal dips.
- Best month benchmark: Use the "Best Month" card to set targets. If January was your best month, can you replicate what drove that?
- Weekly vs monthly divergence: If the weekly chart shows a recent spike but the monthly total is flat, the spike may be a one-off event (e.g., a marketing campaign or referral burst).
- Contact-to-opportunity ratio: Compare the contacts row with the opportunities row in the monthly table. If contacts are growing but opportunities are not, your qualification process may have gaps.
10 GHL Built-in Reporting
In addition to the custom dashboards, GoHighLevel provides its own built-in reporting tools. These are accessed from the Reporting menu in the left sidebar of your GHL account.
Available GHL Report Types
The Reporting section in the GHL sidebar provides the following report categories:
| Report | What It Shows | Relevance to VATable |
|---|---|---|
| Custom Reports | Build your own multi-page reports with any GHL data widgets. Can be scheduled for email delivery. | High - Create bespoke reports for board meetings or client reviews. |
| Google Ads Report | Performance data from connected Google Ads accounts. | Low - Only relevant if VATable runs Google Ads campaigns. |
| Facebook Ads Report | Performance data from connected Facebook/Meta Ads accounts. | Low - Only relevant if VATable runs Facebook campaigns. |
| Attribution Report | Tracks which marketing channels/touchpoints lead to conversions. | Medium - Useful once web forms and tracking are properly configured. |
| Call Report | Inbound/outbound call volume, duration, and recordings. | Medium - Useful if the team logs calls through GHL phone. |
| Agent Report | Per-agent performance metrics (response time, messages, etc.). | High - Track individual team member responsiveness. |
| Appointment Report | Booking volume, no-show rates, and calendar utilisation. | Medium - Useful when GHL calendars are actively used for client bookings. |
| Local Marketing Audit | Analyses your local online presence (Google Business, directories, etc.). | Low - More relevant for consumer-facing businesses. |
- The GHL Dashboard is customisable - click "Edit Dashboard" to add, remove, or rearrange widgets.
- Use the date range picker (top right, "Last 30 Days") to filter all widgets by a specific time period.
- The "Summarize dashboard with AI" button generates an AI-powered summary of your current data.
- Watch the Tasks widget daily - overdue tasks (shown in red) need immediate action.
11 Reporting Cadence - How Often to Review
Having dashboards is only useful if you review them regularly. Below is the recommended reporting cadence for VATable:
| Frequency | What to Check | Who | Time |
|---|---|---|---|
| Daily | GHL Dashboard - Check Tasks widget for overdue items; review Unread Messages count; scan new enquiries. | Charles, Ruby, all team | 5 min |
| Daily | R4 Team Activity - Quick check that new opportunities are being assigned and not sitting as "Unassigned". | Charles | 2 min |
| Weekly (Monday) | R2 Enquiry by Source - Review new enquiry sources from the past week. Are the right channels delivering? | Charles, Ian | 5 min |
| Weekly (Monday) | R3 Conversion Funnel - Check for bottlenecks. How many deals are stuck in "Proposal Sent" or "Follow Up"? | Charles, Ian | 5 min |
| Weekly (Monday) | R6 Weekly Trends - Review the weekly enquiry bars. Compare this week with the previous four. | Charles | 3 min |
| Weekly (Friday) | R5 Lost Opportunities - Review any new losses. Identify high-value losses for follow-up or post-mortem. | Charles | 5 min |
| Monthly (1st) | MI Dashboard (both tabs) - Full executive review of retained clients, engagement value, book value, and billing. | Charles | 15 min |
| Monthly (1st) | R6 Monthly Trends - Review month-on-month growth. Compare against best-month benchmark. Set targets for next month. | Charles | 10 min |
| Monthly (1st) | R4 Team Activity - Full workload review. Are assignments balanced? Does anyone need support or redistribution? | Charles | 10 min |
| Monthly (1st) | GHL Agent Report - Check individual response times and message volumes in GHL's built-in reports. | Charles | 10 min |
- Open GHL Dashboard - clear any overdue tasks (2 min)
- Open R2 Enquiry by Source - note any new high-volume sources (2 min)
- Open R3 Conversion Funnel - identify deals stuck in "Proposal Sent" and follow up (3 min)
- Open R6 Weekly Trends - compare this week's enquiry count with the rolling average (2 min)
- Open R4 Team Activity - ensure no opportunities are unassigned (1 min)
Total: approximately 10 minutes per Monday morning.
12 Debtors Dashboard (R1) - Planned
Status: Planned - Not Yet Built
The Debtors Dashboard (R1) is planned to provide an aged debtors analysis, showing:
- Outstanding invoices - Grouped by age: 0-30 days, 31-60 days, 61-90 days, 90+ days
- Total outstanding balance - Combined value of all unpaid invoices
- Debtor breakdown by client - Who owes what and for how long
- Collection priority list - Ranked by value and age to focus collection efforts
Next Steps for R1
- Confirm which invoicing/accounting tool VATable uses for billing.
- Identify whether that tool has an API that exposes invoice status and ageing data.
- Build the dashboard in the same HTML/Chart.js format as the other dashboards.
- Add to the Monday morning reporting routine once live.